
Eminent softwareproject "GraPi" by students at "Informatics Day"
Students of the »Software Engineering Lab« at Institute of Telematics developed a solution for interactive real-time visualization of wireless sensor networks called GraPi.
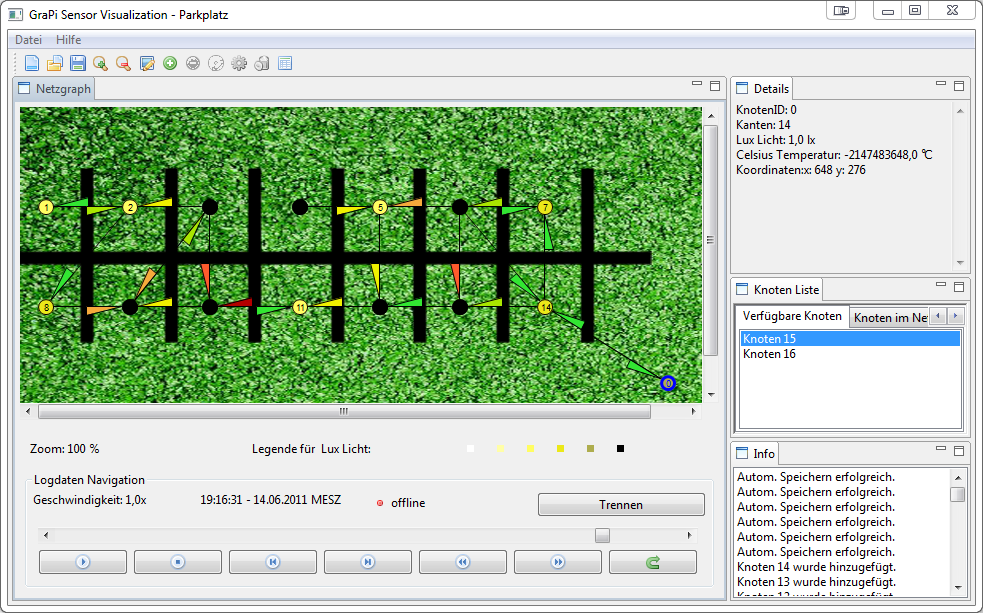
GraPi enables a clearly arranged view on radio links in observed sensor networks. The links are presented as a network graph to the user. On the other hand it provides a graphical presentation of sensor values obtained from sensor nodes. Furthermore GraPi is able to record all observation data and to replay it at a later point of time, enabling analysis of the sensor network in retrospect.
Consequently the software is a versatile tool which can be used in sensor networks research for debugging and evaluation purposes. Userfriendly graphical presentation of sensor values enables utilization of GraPi in real application scenarios (e.g. environment monitoring) as well.
On this year's »Informatics Day« the students presented their project GraPi and showed interesting possibilities for its utilization.